This project is dedicated to my oldest brother Coburn who has always helped me think, within information as it is presented, and then in its myriad of contexts.
Acknowledgements:
Doug for sail reinforcement advice and general humoring of my incessent questions, grommet and sail rope gifts.
Mann Library, Emerson Hall, Crop and Soil Sciences along with a suite of Cornell departments that helped pay for installation costs.
panel 9: 9'6" x 15'9"
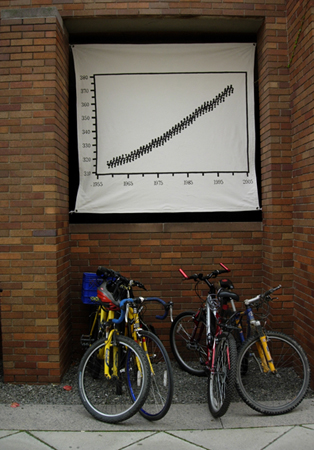
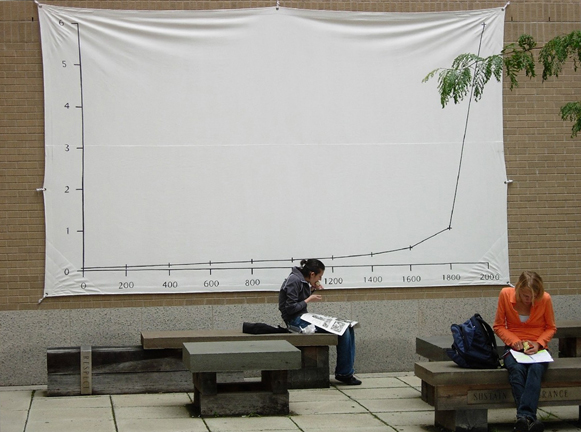
Four Cornell University Professors chose population growth as one of the most important charts they had seen.
Dr. Vernon Briggs (Industrial and Labor Relations): World Population 0 A.D. to 2000 A.D. "I know that better economic organization beginning in the 16th century followed by improved health practices in the 19th and 20th centuries led to dramatic increases in the world's population. But until I had seen this graph, I had not visualized the sudden break from the long term trend."
To see the different world population submission images from each faculty, click on their names: Vernon Briggs, John McClain,Yervant Terzian, and anonymous.
panels 1-8: 6'x6'6"
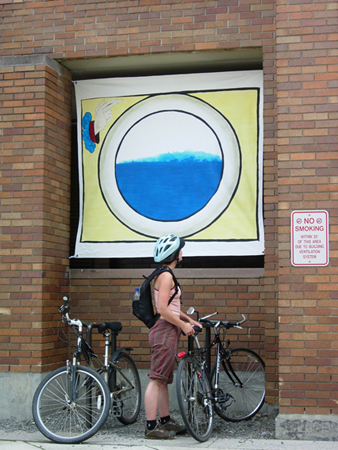
Panel 1, Dr. Kathie Hodge (Department of Plant Pathology): An image from the Nuremberg Chronicle, 1493
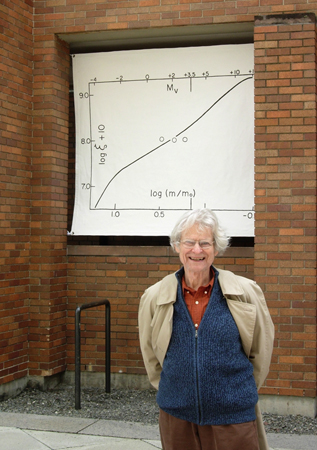
Panel 2, Dr. Ed Salpeter (Physics Department, Emeritus): The frequency of supernova's to give us the heavy elements of the periodic table
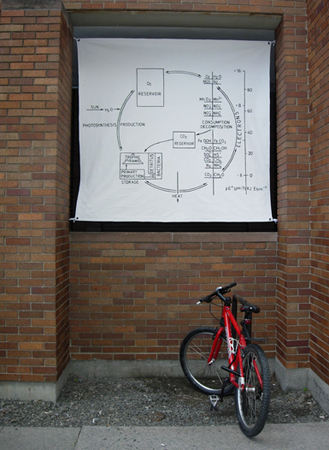
Panel 3, Dr. Eugene Madsen (Department of Microbiology): How the world works, the biosphere from a thermodynamic perspective
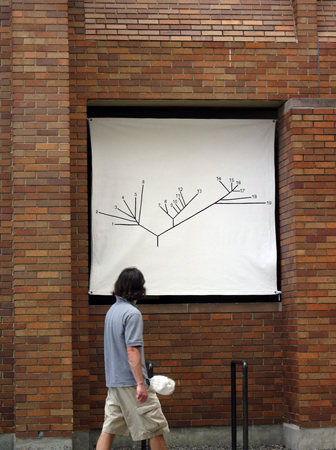
Panel 4, Dr. Dan Buckley (Department of Crop and Soil Science): The tree of life
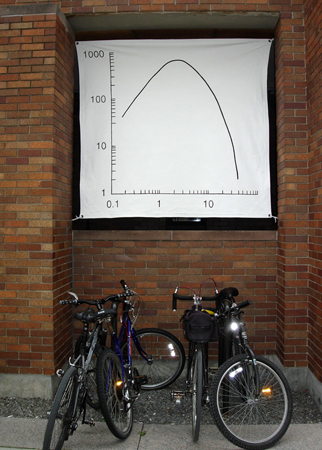
Panel 5, Dr. Sheila Hemami (Department of Electrical and Computer Engineering): Human Contrast Sensitivity Function (CSF) provides a representation of our spatial vision
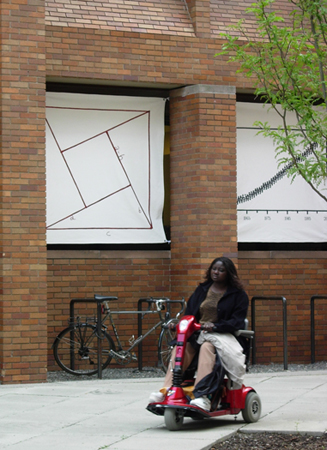
Panel 6, Dr. Michael Evan Gold (Department of Industrial and Labor Relations): An elegant proof of the pythagorean theorem
Panel 7, Dr. David Wolfe (Department of Horticulture): Atmospheric CO2 concentration
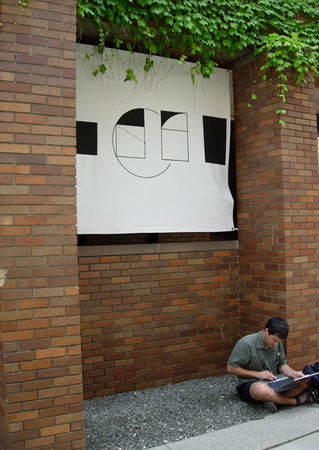
Panel 8, Todd McGrain (Department of Art): Golden Section.
Panel 8, Todd McGrain (Department of Art): Golden Section, to see Todds submission go here.
To quote Todd: "My high school art teacher, Harvey Broccoli, at West Irondequoit High School in Rochester, NY, taught me to draw this diagram. Each time I draw it, I feel I am participating in an elemental and ancient ceremony, a ceremony that attempts to both generate beauty and at the same time explain beauty."
Panel 7, Dr. David Wolfe (Department of Horticulture): Atmospheric CO2 concentration, to see David's submission, go here. This piece was also incorporated nto the Hot Bed installation, varnished and laid down as a rug. It is also featured as the olive plate in the Graphic Dinner I hosted to kick off the Copenhagen Climate talks.
So here we are, humans, with our own kind of perception (Panel 5) and multiple ways of thinking about the same thing (Panel 6). I chose this graph, because it one of my most important or meaningful graphs. I was in Dr. Murray McBride's class when I first saw it. It is a graph of increasing carbon dioxide in the northern hemisphere. When I saw it, I was stimulated by the valleys and peaks- these represented the carbon absorbed by plant growth and death of plant life annually. What struck me was the amount of carbon overall that was increasing relative to what could be absorbed in a growing season. It changed my life.
Panel 6, Dr. Michael Evan Gold (Department of Industrial and Labor Relations): An elegant proof of the pythagorean theorem, to see Michael's submission, go here.
So, there are many different ways of proving the pythagorean theorem - that is, there are many different ways of showing the same relational principle in geometry and in the world. What is so fun about this one, is that the author of this proof, presented it and simply said: Behold! Imagine a NY Times readership having a kind of scientific literacy that it would be able to have these kinds of puzzles on a daily basis.
Panel 5, Dr. Sheila Hemami (Department of Electrical and Computer Engineering): Human Contrast Sensitivity Function (CSF) provides a representation of our spatial vision, see her submission go here.
From Dan's graph (Panel 4), #14 is the branch of life that includes all animals - birds, mammals, fish etc. Sheila's graph is the range of human perception. A cat or a hawk will have the diagram shifted left or right - that is, cats and hawks perceive the world differently than we do. Besides being an excellent example of the exponential function depicting of our ability to see shapes in a large range of light, I loved thinking about how evolution created a range of visualality between animals.
Panel 4, Dr. Dan Buckley (Department of Crop and Soil Science): The tree of life. To see Dan's submission, please go here.
In the bottom left corner of Gene's cycle (Panel 3), is a small box depicting biologic life, a biomass pyramid of sorts. This graph submitted by Dan is the family tree of biologic life. I chose this graph for several reasons: 1) I have always loved this graph; 2) It is revolutionary moment in evolutionary biology - it quantitatively depicts the family of living organisms, bacteria to humans in one family tree; 3) My favorite part of this diagram is the base of the tree, called LUCA or Last Universal Common Ancester - we don't know our oldest ancester but it was something bacterial! Please see my piece entitled Garden of Eden.
Panel 3, Dr. Eugene Madsen (Department of Microbiology): How the world works, the biosphere from a thermodynamic perspective. To see Gene's submission, click here.
I chose Gene's diagram because of the simplicity and audacity of it: How the world works! and the sun is just that, 3 simple letters: "sun" with a modest input arrow on the upper left hand corner. While I found this diagram beautifully simple, I also found it very funny. Basically, it is the cycle of Ed Salpeters's materials (Panel 2) as they are innervated by sunlight energy.
Panel 2, Dr. Ed Salpeter (Physics Department, Emeritus): The frequency of supernova's to give us the heavy elements of the periodic table. To see Ed's submission of his own graph, click here.
Ed met with me to explain his graph. Until his graph in the 50's, no one knew how to explain the existence of metals after iron (Fe) on the periodic table because these extremely energy intensive elements could only be made by exploding supernovas and there weren't sufficient supernovas in the universe to be a probable source. He posited, that while not currently existent, Supernovas existed long ago and exploded in a different time scale. Like Panel 1, we posit reality, and I love that.
Panel 1, Dr. Kathie Hodge (Department of Plant Pathology): An image from the Nuremberg Chronicle, 1493, as part of a Timeline of Timelines. Click here for the original source.
I chose this image for two reasons: 1)The Nuremberg Chronicle was the first encyclopedia or the beginning of the publication of science to communicate across academic and national boundaries. 2)The image, of the first day of creation, perhaps made by Durer, is an incredible abstraction of the inner and outer atmosphere. It made me wonder, prior to knowing the world was round, if I were lying on my back looking up into space, how would I depict earth?
acrylic on canvas, grommets, sail rope
panels 1-8: 6' x 6'6"
panel 9: 9'6" x 15'9"
summer 2006
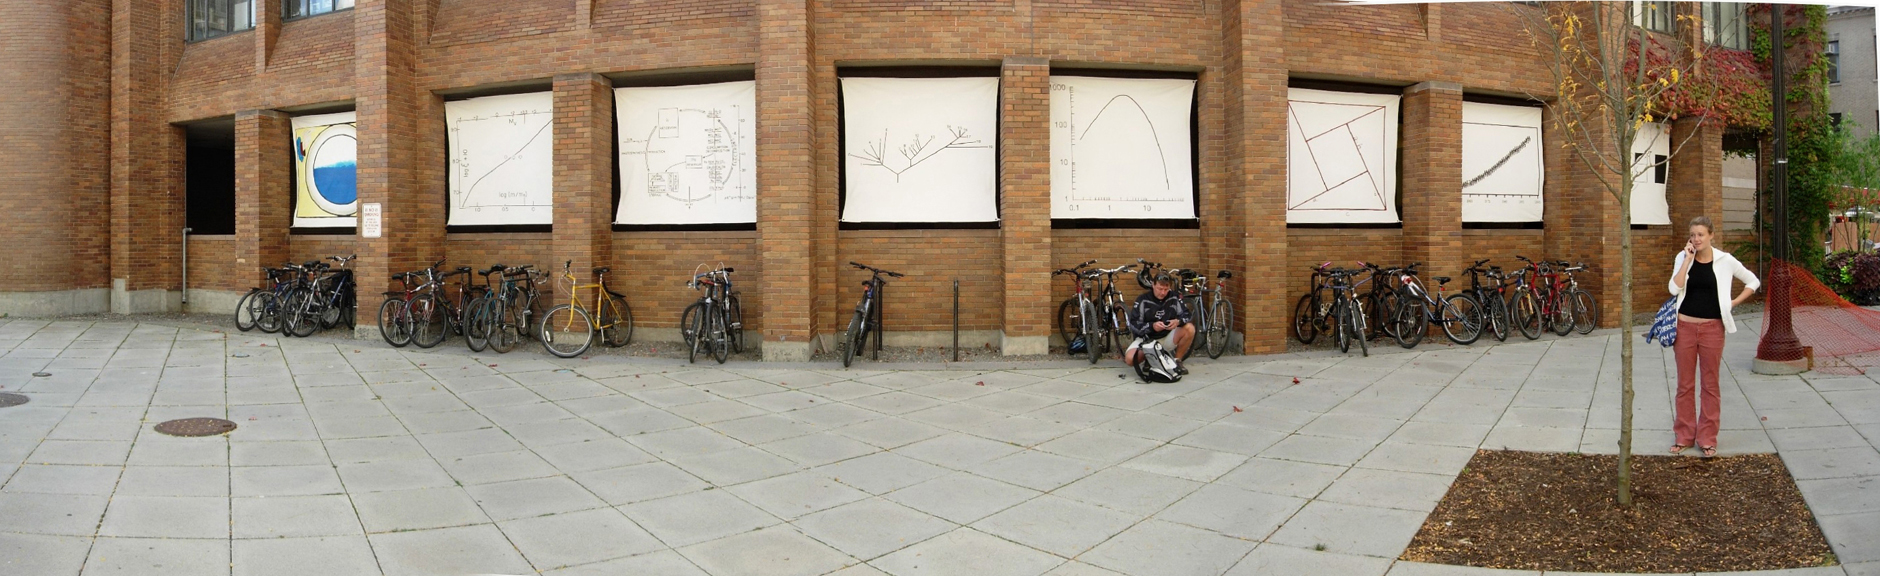
Scientific data were painted on large sail canvas for an outdoor installation. All Cornell University faculty were surveyed to obtain the most important chart they have seen in their lifetime. Source material can be seen on the Visualizing Meaning website.
A Chart is defined as a graph, map, diagram, table or ‘other.’ A selection of these images was painted on canvases larger than human size. These illustrated reproducible facts are messages from senders to receivers that evolve theories.
In 2001, while I avoided writing my Masters Thesis, I took my first trip to Europe. In some museum, I saw a pencil drawing of a crack in a jail cell wall. As I recall, the artist had been imprisoned and the crack in the cell was a form he saw everyday. Looking at scientific graphs, thin black lines drawn in white rectangles, I often feel imprisoned with ideas. The information is a thin opening to the world, necessary, but not sufficient for liberation. None the less, science is a vector of understanding through time - ideas building on ideas - innervating our understanding of the world.
In 2007, I was commissioned by Mann Library to do more with these images for the inaugeral show of the Bissel Gallery. To see this domestication of the graphic, please visit Copying the Masters.